R: Create a histogram from frequency list
In R, hist is a great function to create histograms from data.
It counts data, compute frequency, and show a histogram.
Then how can I get histograms from frequency data that I already have?
I wasn’t able to find nicer solution, so wrote this.
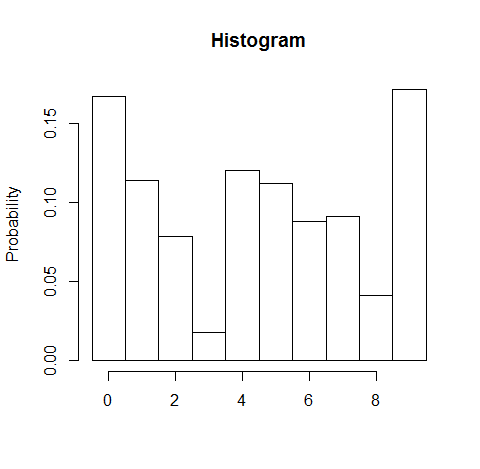
> hist.from.freq(seq(0, 9), c(154, 105, 72, 16, 111, 103, 81, 84, 38, 158), normalize = T)This sample gives the following output: